.png)
Equity Line Monitor - Monitor your equity curve with precision.
Category: Account & Risk Management Tools
Last updated: 2025-09-26
Terminal: MT4
Preferred pairs: All
Timeframe: Any
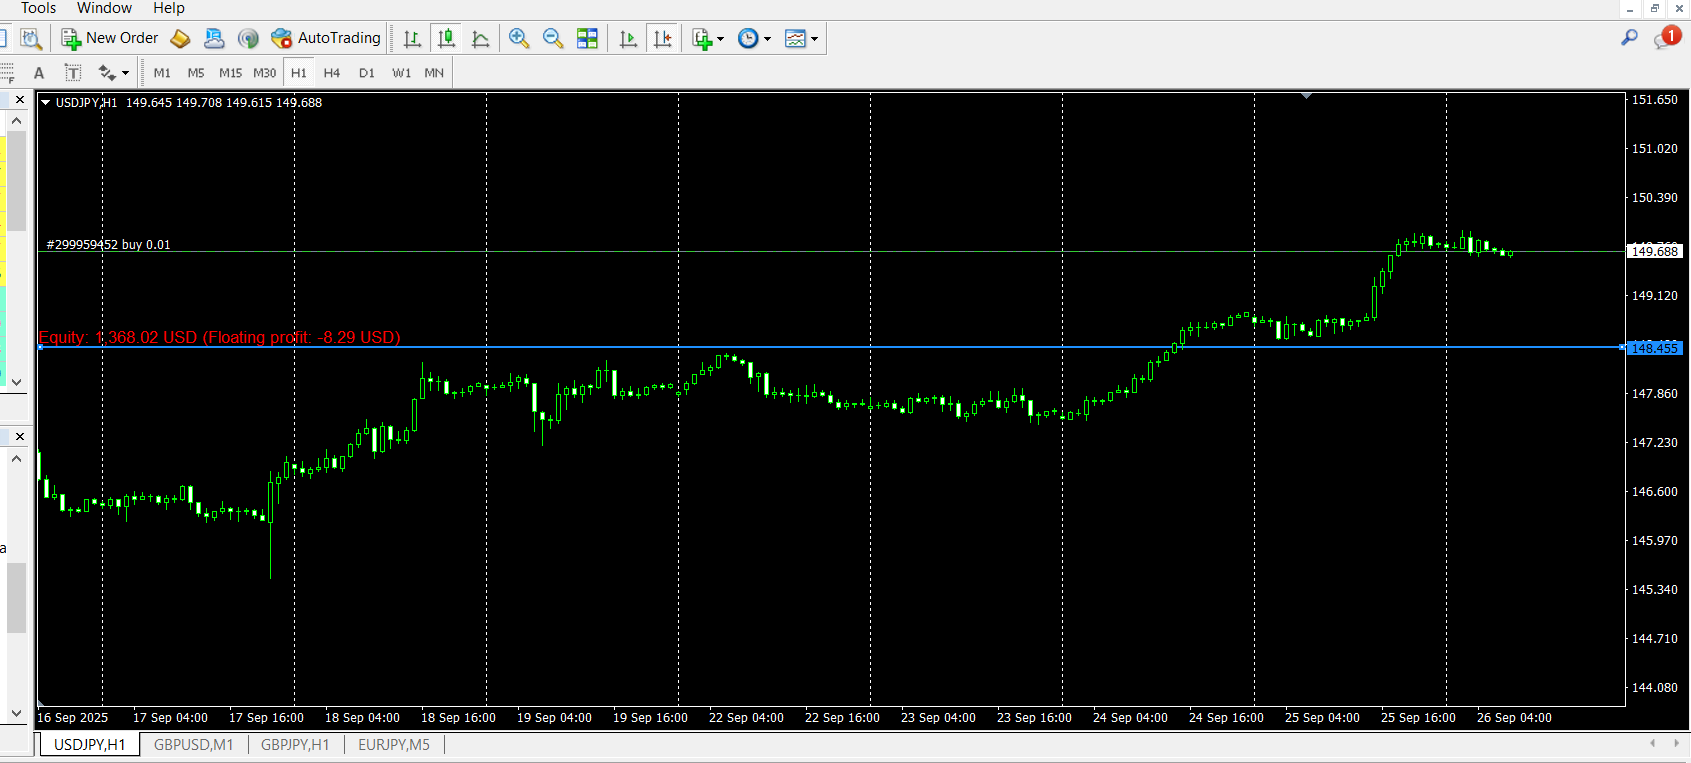
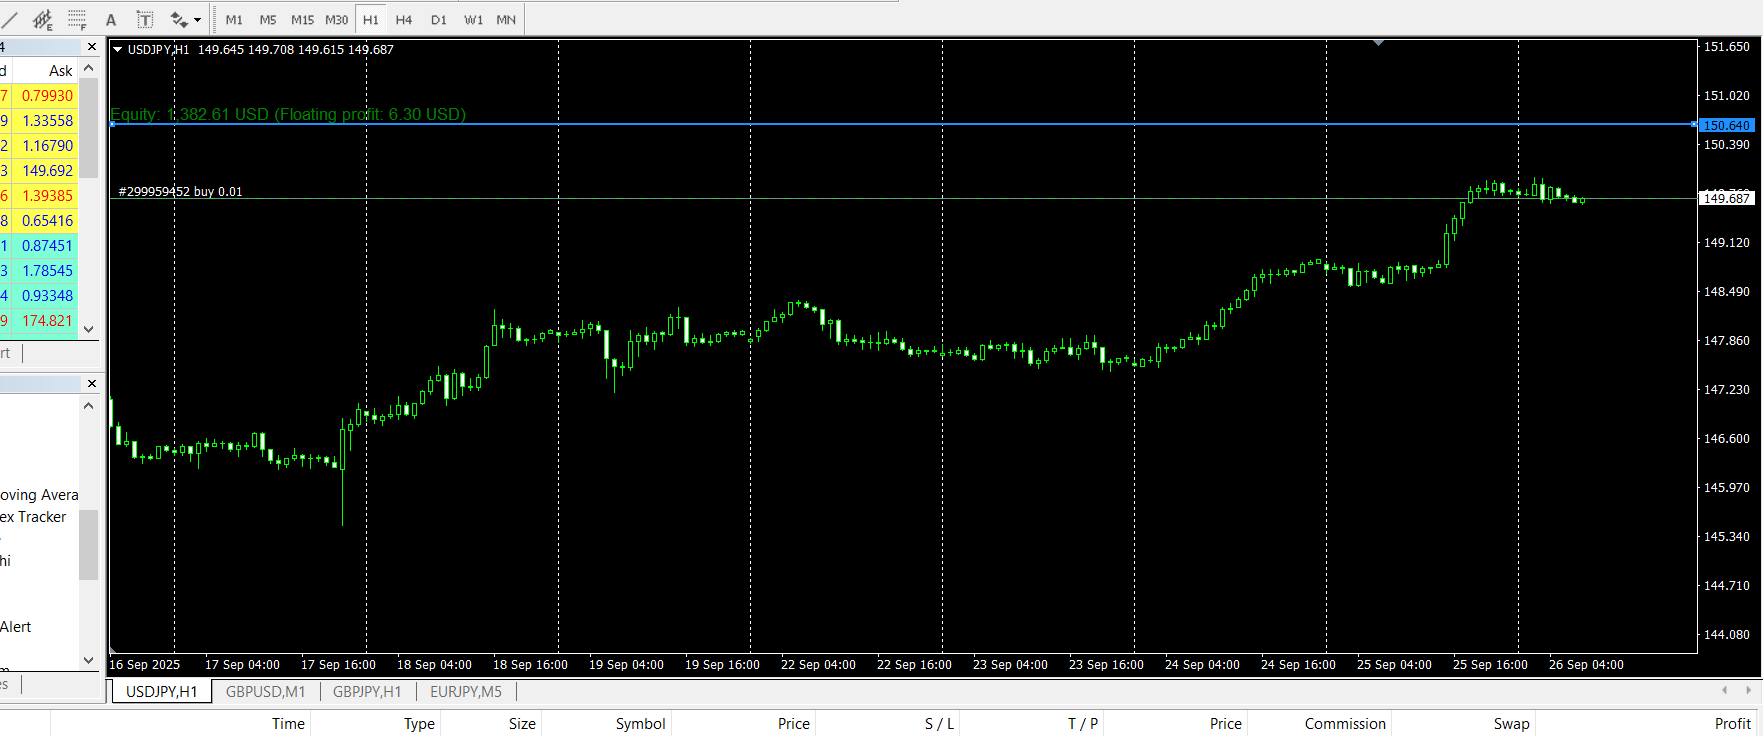
Equity Line Monitor is an MT4 Expert Advisor that tracks your account’s equity curve in real time and projects your future equity at any price level you choose. Unlike balance, which only updates after trades close, equity reflects your live floating profit and loss, giving you the most accurate picture of your account health.
Why Use Equity Line Indicator?
It’s not always easy to know how much equity you will have if price moves to another level. With Equity Line Monitor, you can instantly calculate your expected equity at any price you select.
✅ Plan future scale-ins with confidence.
✅ Check if you will still have enough equity if price goes against you.
✅ Visualize how stop-loss or take-profit exits affect your account.
✅ Avoid margin calls by planning ahead.
The EA calculates the net volume of all open trades on the current symbol, then shows:
-
The future equity at your selected price.
-
The floating profit/loss that would result.
If the change is positive, the value is shown in green; if negative, in red.
This makes it much easier to plan trades, manage risk, and set realistic exit levels.
Why Is It Useful?
Most traders only track balance or look at floating P/L, but Equity Line Monitor shows you the true story:
-
Equity curve vs. balance curve in real time.
-
Projected equity at any price level.
-
Instant drawdown visualization.
-
Clearer performance evaluation for strategies and EAs.
It’s especially powerful for EA developers, prop trading challenges, and risk-conscious manual traders.
Key Features
-
Equity Curve Display – Plot your live equity below the chart.
-
Future Equity Projection – See your expected equity at any chosen price.
-
Balance vs. Equity Comparison – Check the difference between closed and floating results.
-
Color-Coded Values – Green for profit, red for loss.
-
Customizable Lines – Adjust color, style, and width.
-
Real-Time Updates – Refreshes instantly with market ticks.
-
Drawdown Monitoring – Spot equity dips quickly.
-
Lightweight – Optimized for speed, even on long histories.
Input Parameters
-
MaxBars (default = 500) – Number of bars to display (0 = unlimited).
-
EquityLineColor – Color of the equity curve.
-
BalanceLineColor – Color of the balance curve (optional).
-
LineWidth – Thickness of equity/balance lines.
-
RefreshRate – Update frequency (default: every tick).
-
ShowBalanceLine (true/false) – Toggle balance line on/off.
-
EnableAlerts (true/false) – Get alerts when equity drops below a threshold.
-
EquityAlertLevel – Set the equity level where alerts trigger.
Example Use Cases
1. Strategy Testing
Run your EA and compare balance vs. equity to see if drawdowns are hidden behind floating trades.
2. Risk Planning
Drag the line to a projected price → see if your equity will survive. If not, adjust position size or stops.
3. Prop Firm Challenge
Monitor equity drawdowns in real time to avoid breaching limits.
4. Manual Trading
Set your target and instantly see what your account equity will look like if price hits it.
Example:
On XAG/USD with two long trades open, if price drops to 40.731:
-
Projected equity: 3,289.26
-
Floating loss: –354.50
Result → you can plan risk more precisely before price even moves.
Why Choose Equity Line Monitor?
Because it goes beyond balance and floating P/L, giving you the real story of your account:
-
Monitor live equity curves.
-
Project future equity at any price.
-
Plan trades with risk awareness.
-
Stay compliant with prop trading rules.
Equity Line Monitor = smarter risk, clearer decisions, safer trading.